


Marlborough, New Zealand
MGGCOOP: consistent yield counts across 85 growers
Yield estimation and crop-load management for a co-op that sells its wine first.

At a glance
- 1.6 million vines counted the same way, every time.
- 85 vineyards on one comparable basis for the first time.
- 1 week from final counts to a co-op-wide yield model.
A co-op that sells its wine before growing it cannot afford forecast surprises at harvest time. But when 85 growers each counted bunches their own way - different methods, different sample sites, human nature picking the better vines - the numbers were never comparable. The fix wasn’t more counting. It was one method that doesn’t care.
- Customer
- Mart Verstappen at the Marlborough Grape Growers Cooperative (MGGCOOP), Marlborough, New Zealand (85 growers, 1.6M vines, 12,000-15,000 tonnes).
- Use case
- Yield estimation & crop-load management.
- Setup
- Full winter bud counts + monthly summer sampling on fixed rows delivered by Flowerday Contracting; data into every grower’s own login by next morning, flowing on into the co-op’s systems.
- Result
- Every vine counted the same way; a co-op-wide yield model built on the data within a week of final counts; crop-load policy enforced against real numbers.
The challenge
The old protocol relied on small samples applied to whole vineyards: someone was hired to count a handful of bays and the result was scaled up to the rest of the block, while growers chose their own sample sites, with biases everyone knew about. This is fine for a single block, but makes results incomparable across the entire co-op.
The opportunity
Cropsy’s winter bud counts and monthly summer passes gave Mart the same measurement, taken the same way, on every member’s blocks. That turned yield estimation from 85 different methods into one comparable set of numbers, and gave the co-op a single basis for setting block targets, planning thinning and committing tonnes to the wineries.
What happened
- Objective counts put “accuracy” in perspective. Every vine, counted the same way, every time. Growers spot-checking the counts found them within about 2% of their own - a gap some growers considered large. The co-op’s view is the opposite: ±2% or more is normal measurement noise in a living system, where a wet or dry spell at the wrong moment moves yield far more than that. What matters is that every block is now measured the same way, so the numbers are finally comparable, and the argument moves from “whose count is right” to “what do we do about the crop”.
- The co-op built its own model on the data. Within a week of the season’s corrected counts landing, Mart had a co-op-wide yield model built from regional bud and bunch counts, including a bud-to-bunch conversion factor derived from the data itself. It stood a full month before the traditional January berry-weight sampling, which is still used to turn counts into tonnes.
- A crop-load policy with teeth. With real counts in hand, a yield cap was enforced across the co-op. One grower dropped a cane for yield control and landed on target, and over-cropped blocks were flagged before they could “turn to custard at harvest”.
- Right-sizing the program. After two full-coverage winter passes, the co-op moved to 50% winter coverage. Mart’s judgement is that half coverage keeps the bud counts that drive winter decisions, while letting the same budget go further across the season.

The results
- Comparable numbers across 85 vineyards for the first time, providing one basis for targets, thinning and intake planning.
- A vintage harvested to plan against pre-sold volumes.
- A scanning program sized to the decisions: a winter census scan to establish the baseline, then sample as much as the decisions actually need.
“Previously, we would contract someone to do a bud count on a certain number of bays and then apply that to the whole vineyard. It was only a very small sample but now every single vine is being scanned - that’s about 1.6 million vines across all our growers. Cropsy scanning is very cost effective and provides us with a large data set with increased accuracy - something we never had before.”
What’s next
Cropsy’s yield heatmap can direct maturity sampling, letting the count density decide where the sugar samples should come from to capture high and low yielding areas accurately.
More case studies
-
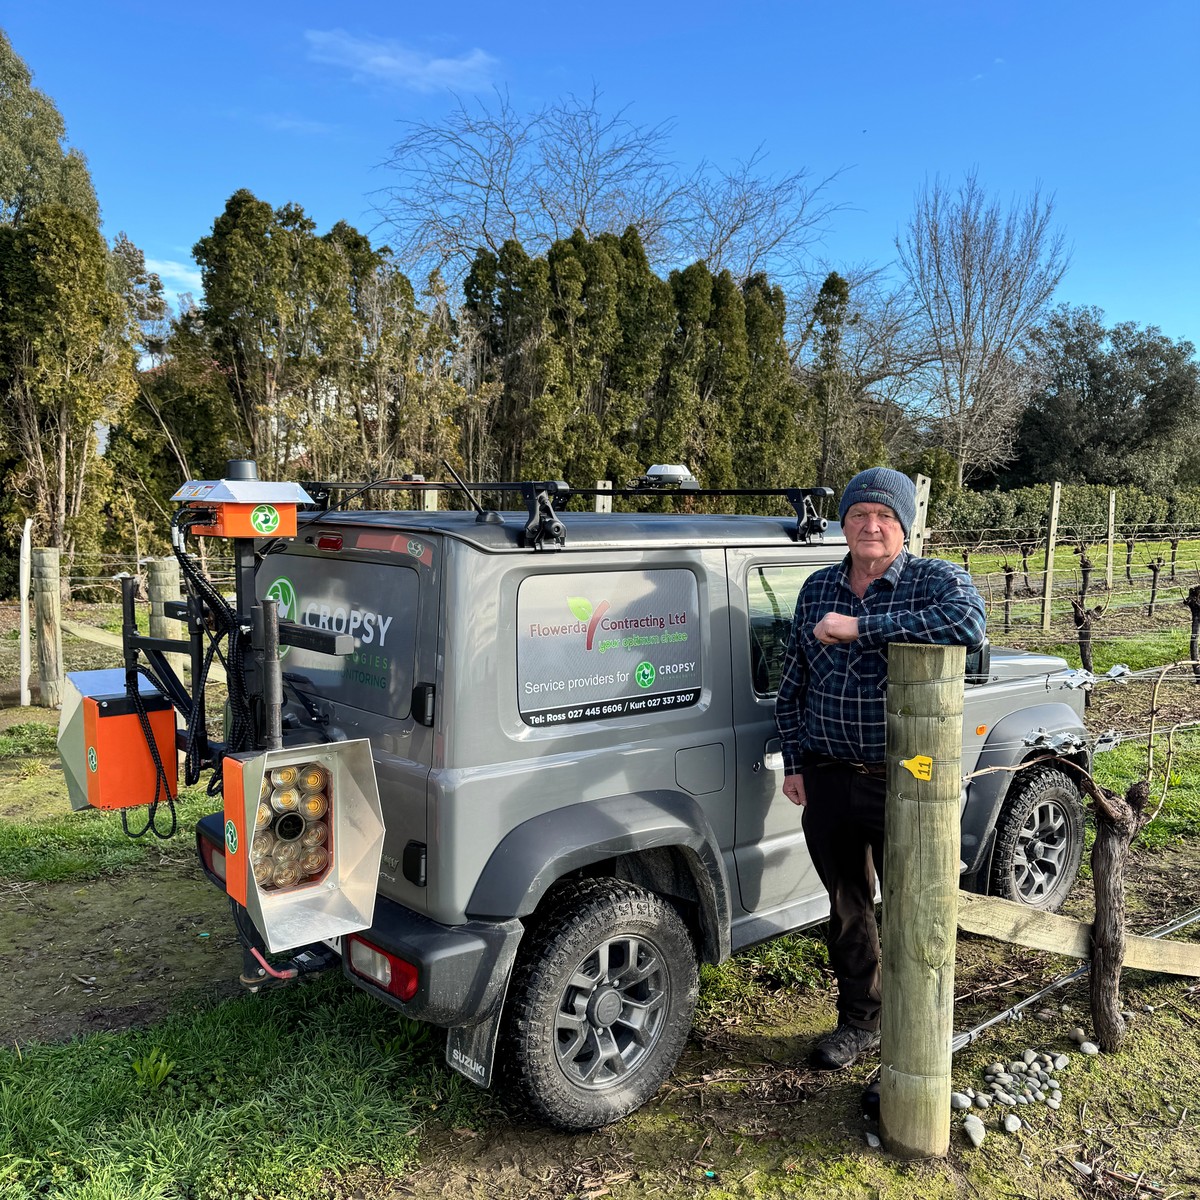
Flowerday Contracting Marlborough
A scanning business on one Jimny
New Zealand’s first Cropsy service provider: one scanner on a Suzuki Jimny, over 100 growers, and pruning QA turned into a product line.
-
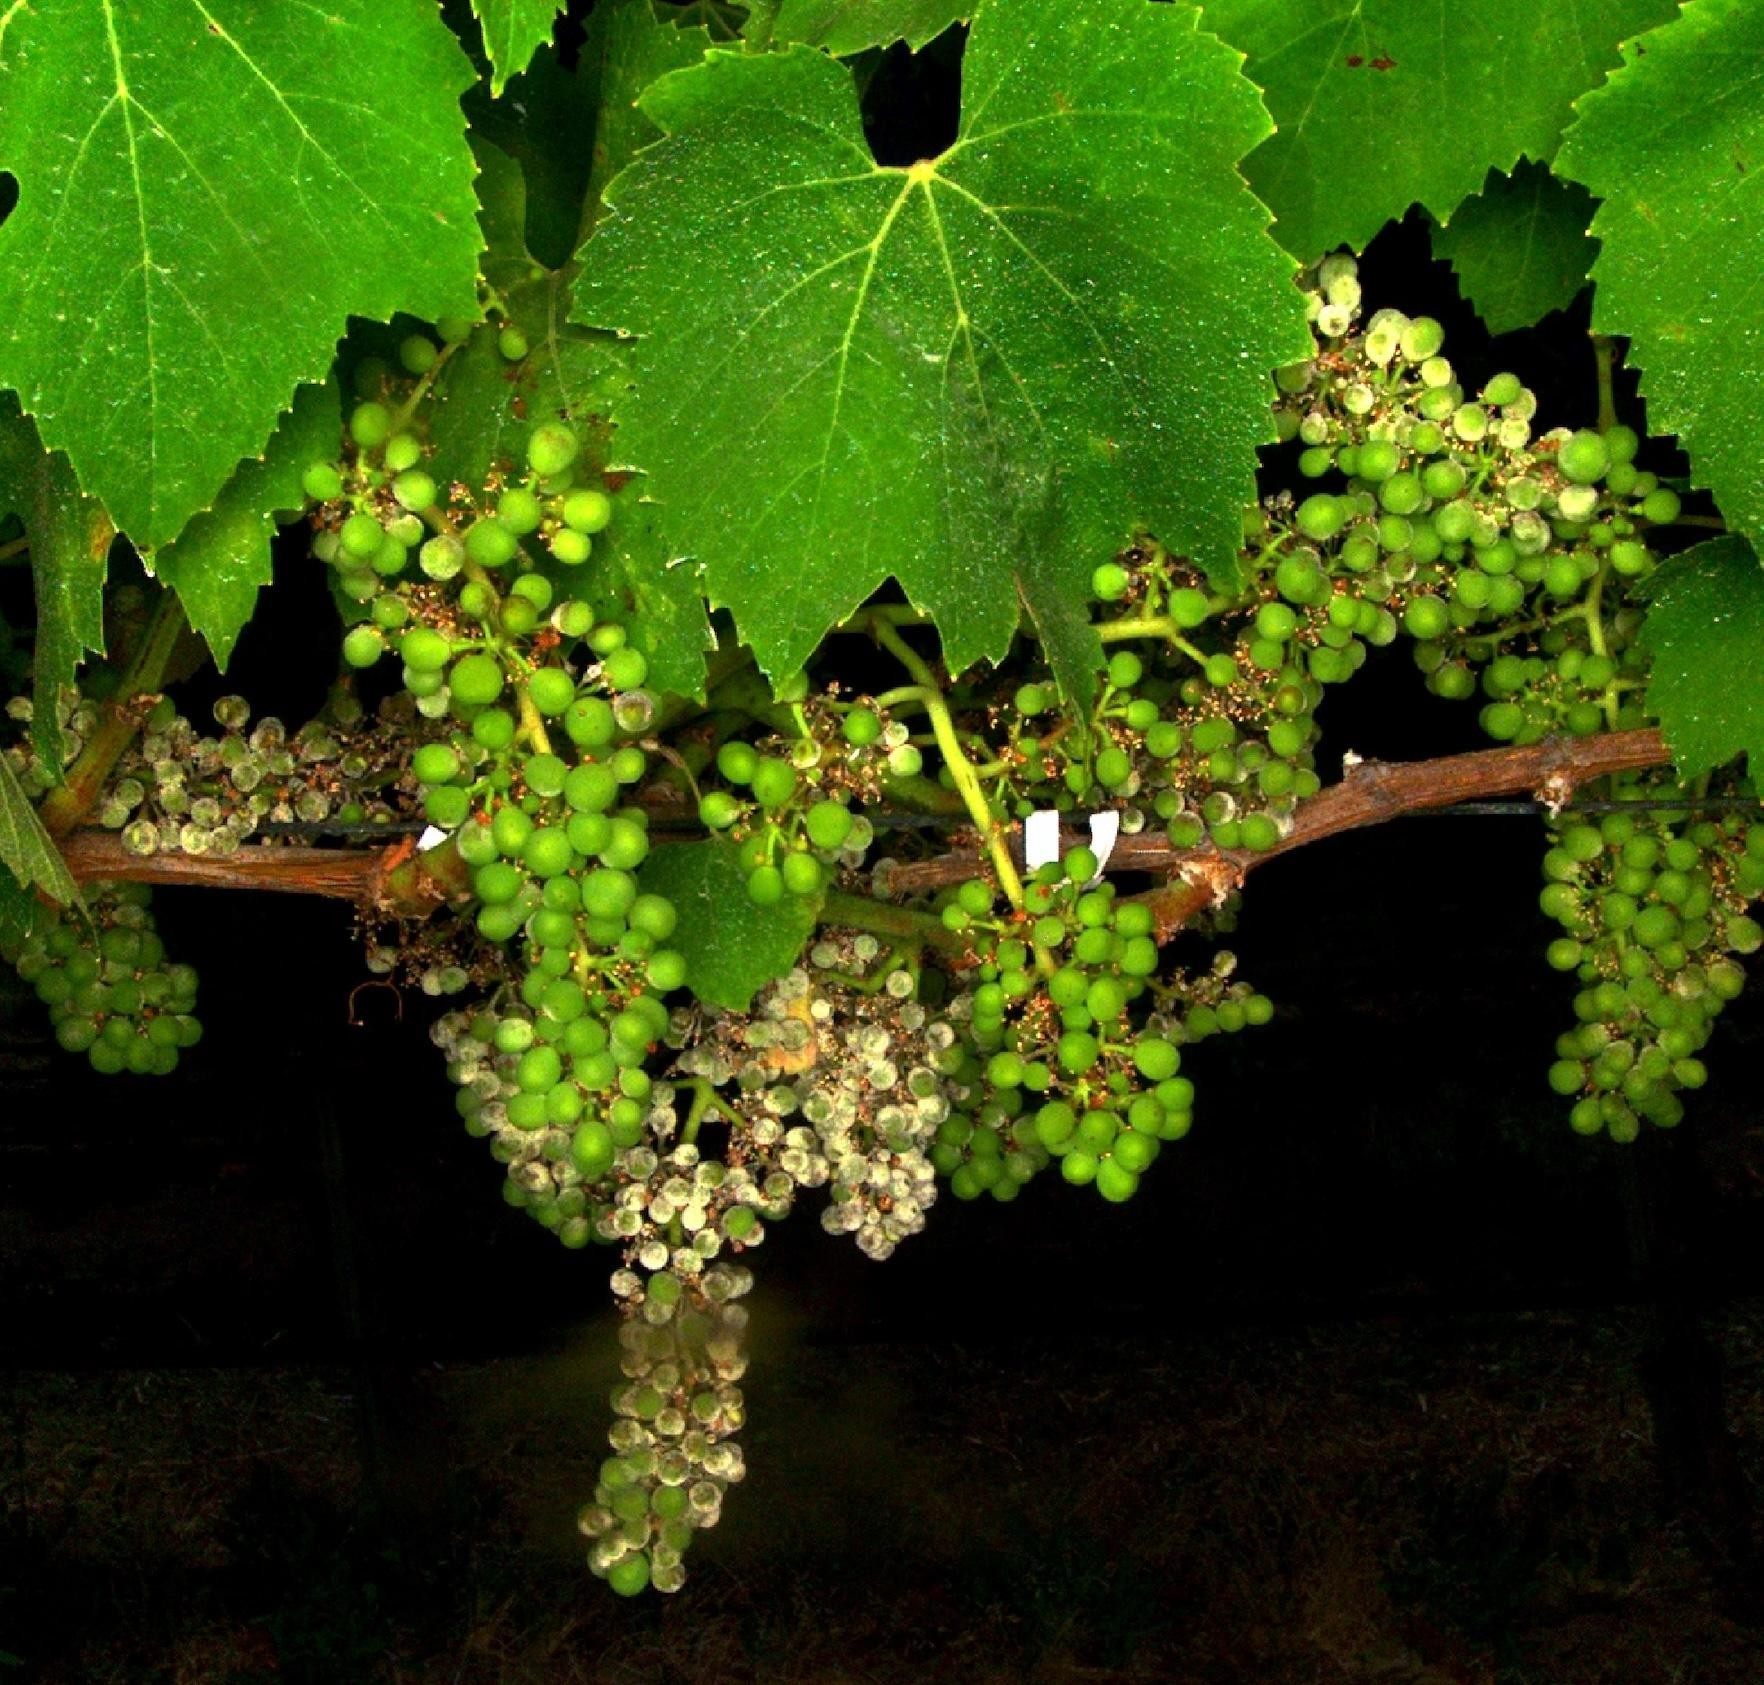
MGGCOOP Marlborough
A co-op disease protocol built on data
One quantified disease standard across 85 growers, with an evidence path all the way to fruit rejection.