

Marlborough, New Zealand
One scanner for every step of the season
Pruning, yield and trunk disease across three Awatere Valley vineyards, from one scanner.

At a glance
- 210 ha across three Awatere Valley vineyards, nearly half a million vines.
- About a week to count every block for yield, instead of weeks by hand.
- 16 days to scan nearly 284,000 vines for trunk disease.
Shane Rohloff manages vineyards in Marlborough’s Awatere Valley: around 210 hectares and nearly half a million vines across three vineyards. He runs a single Cropsy scanner on a vineyard minitruck and uses it right through the season to check pruning in winter, estimate yields in spring and map trunk disease and dead vines before harvest.
- Customer
- Shane Rohloff, Awatere Valley, New Zealand (around 210 hectares).
- Use cases
- Year-round: pruning quality, yield estimation, and trunk disease and replant planning.
- Setup
- One Cropsy scanner on the minitruck, run by Shane’s team. It scans every vine in winter, samples every block in spring, and ran a dedicated trunk-disease scan in late 2025.
- Result
- Pruning checked row by row the morning after; every block counted for yield in about a week instead of weeks of hand counts; nearly 284,000 vines scanned for trunk disease in 16 days; dead vines removed and replants planned by exact row number.
The challenge
With nearly half a million vines to manage, Shane’s team can’t be everywhere at once. The most important thing is knowing where people are needed, rather than spending their time hunting for problems.
Traditionally, that means checking the vineyard a little at a time. Pruning quality is spot-checked, trunk disease is picked up by eye, and crop estimates are built from hand-counting a small number of vines. Most of the vineyard might be perfectly fine, but finding the rows or patches that aren’t can mean hours of walking or driving.
Crop estimation was one of those jobs nobody wanted to do. “It would take weeks and is very tedious,” Shane says, “and you only get a tiny sample of our vineyard.”
The opportunity
Shane could use the farm’s minitruck to check every block in all three vineyards in a fraction of the time. Just one scanner, run by his team, could show Shane a vine-by-vine record throughout the season: buds and canes in winter, inflorescences in spring, and trunk disease and dead vines before harvest. The team could then spend its time doing the work, rather than finding it.
What happened
Pruning: checked the morning after
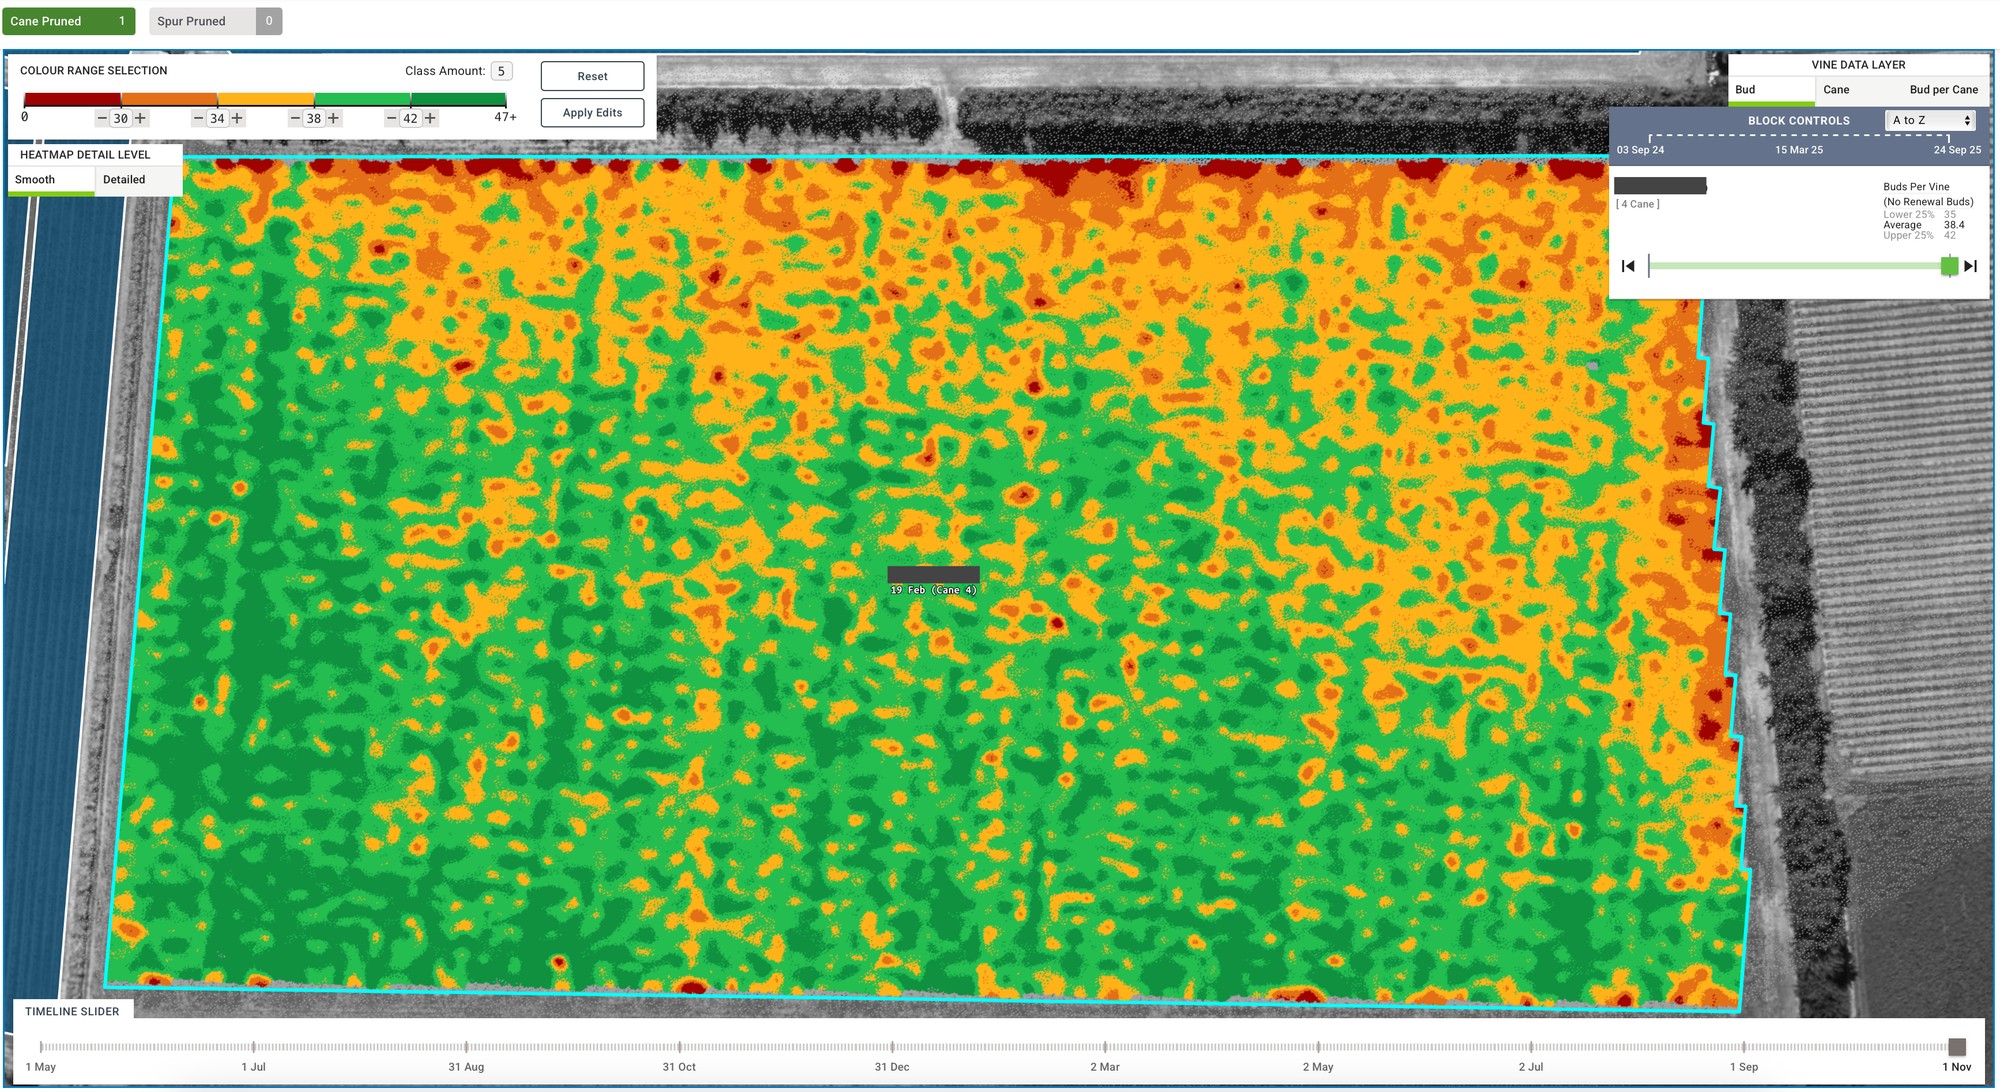
- Pruning checks while the crew is still there. Pruners are told to prune to vigour across each block, using the previous season’s bud and yield heatmaps alongside Pellenc Connect tonnage maps. The post-pruning scans show whether the plan was followed. Reports are ready the morning after each scan, while the crew is still in the vineyard.
- Causes of low bud counts. A low bud area isn’t always a pruning problem. Cropsy helps distinguish weaker areas of the block from rows that have been over-pruned. Shane has found that using this information to reward good pruners results in better pruning outcomes.
Yield: every block in about a week
“Our team loves the Cropsy inflorescence scan. It’s quick and less tedious and is a far bigger sample of vineyard area.”
- No more weeks of hand counting. Inflorescence scans now cover every block in about a week, and a small amount of hand counting calibrates them.
- A combined estimate the team trusts. For the 2026 vintage, combining the Cropsy counts with bunch weights and bunch counts taken just before harvest gave the team “a pretty accurate picture of the final tonnage,” says Shane.
- An early read on the season. The bud maps from the winter scans come first, months before the spring counts. Shane finds the bud and bunch heatmaps line up closely with the farm’s Pellenc Connect tonnage maps and with his own knowledge of the vineyards.
Trunk disease and replanting: the right row, not every row
- Trunk disease scanned in 16 days. Shane was one of the first growers to use Cropsy’s trunk-disease scan in late 2025. The minitruck scanned nearly 284,000 vines across two of the three vineyards in 16 days. Until then, trunk disease had never been measured across these vineyards.
- Less widespread than feared. “The blocks weren’t as bad as we thought,” says Shane. The scan confirmed the worst blocks the team had already picked out in the field. It also showed how many vines were diseased, and mapped them to exact rows.
- Pinpoint dead-vine removal. The dead vines were removed before harvest so the loose trunks wouldn’t get caught in the harvesters and slow picking down. More importantly, it removed infected plants that were a source of further disease. Shane has a dedicated staff member who manages replants, trains young vines and removes dead ones. Instead of driving every row to find that work, she now gets the exact row numbers to go to.
- Replanting where the young vines are easiest to care for. Looking after over 1,000 replants in a season is hard for one person, especially when they are scattered across three vineyards. The team uses the Cropsy data to plan their replanting in tight sections, which makes it easier to care for young vines and improves replant success.
Turning field knowledge into measurements
Shane and the team know these vineyards well, and the Cropsy scans often confirm what they already see: which blocks have the most trunk disease, where vigour drops away, and roughly how the crop is shaping up.
Getting the confirmation still takes work, and the difference now is that the crew no longer have to rely on an impression of each block; they have the details. They know how far problems extend, which rows are affected, and whether things are getting better or worse. Without that, a good result is luck and a bad one is a surprise at harvest.
Sometimes, the data reveals that things are better than expected, and sometimes it’s the opposite. In Shane’s case, there was less trunk disease than the team feared, and that’s important information for planning where to replant and when.
The results
- Pruning checked row by row the morning after each scan, against the season’s vigour plan.
- Every block counted for yield in about a week, feeding a final estimate the team trusts.
- Nearly 284,000 vines scanned for trunk disease in 16 days, and the disease found to be less severe than feared.
- Dead vines removed, and replants planned, by exact row number.
- One scanner, run by Shane’s own team, covering pruning, yield and vine health across the whole season.
“Cropsy data shows really clearly if an area is low in bud numbers and whether it’s because of the block conditions or bad pruning…the bud maps are our first indication of crop and give me a good idea of how this season is going to go.”
More case studies
-
Flowerday Contracting Marlborough
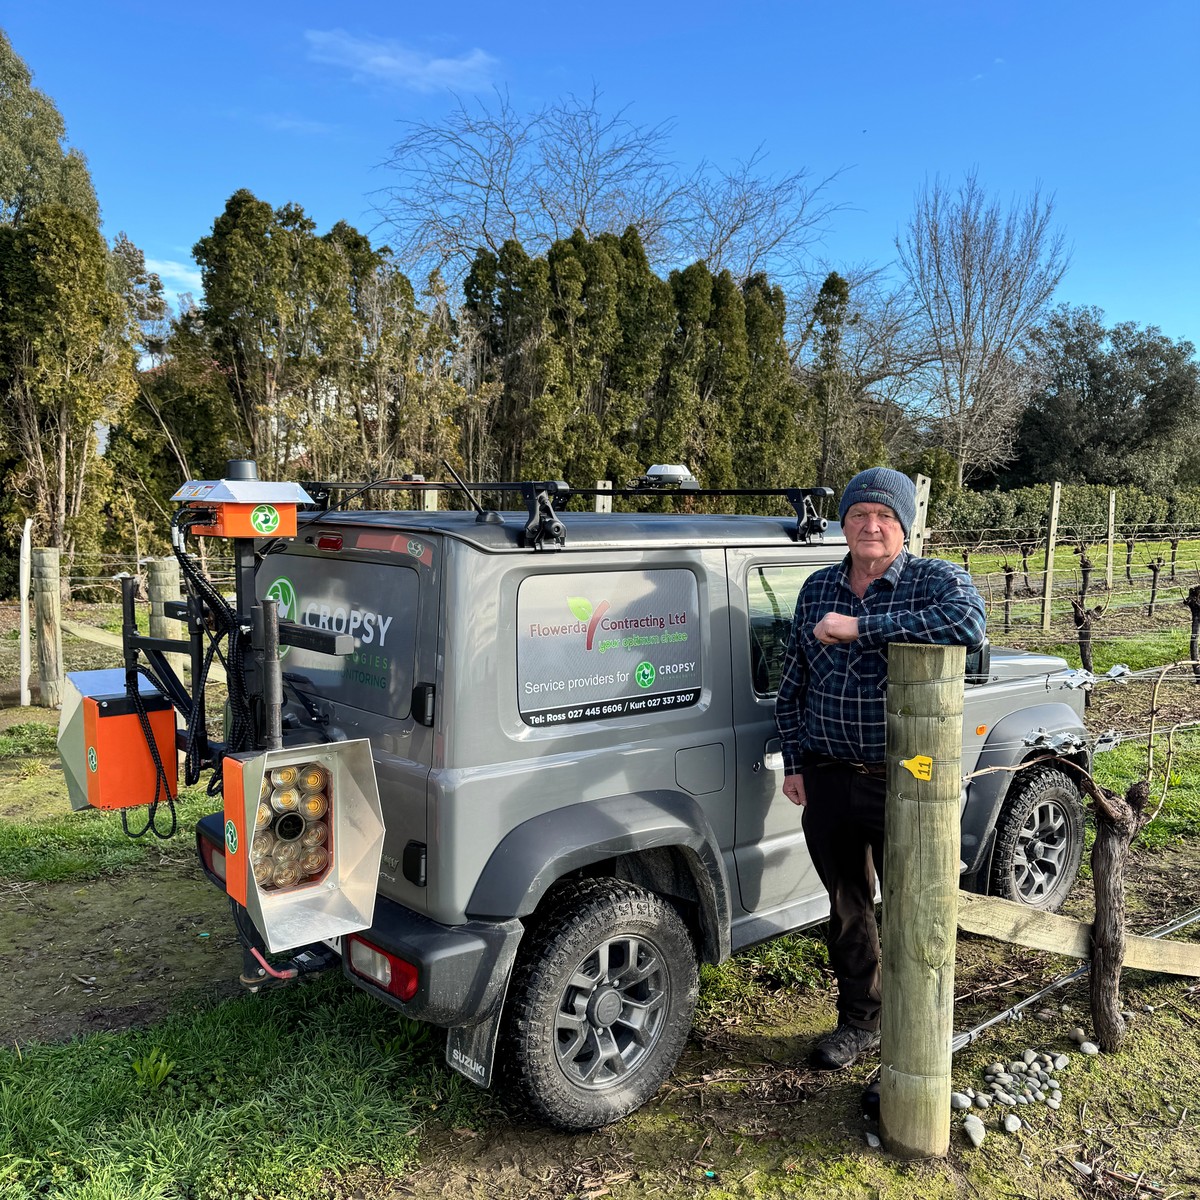
A scanning business on one Jimny
New Zealand’s first Cropsy service provider: one scanner on a Suzuki Jimny, over 100 growers, and pruning QA turned into a product line.
-
MGGCOOP Marlborough
Consistent yield counts across 85 growers
Every vine counted the same way, and a co-op-wide yield model built on the data within a week of the final counts.
-
MGGCOOP Marlborough
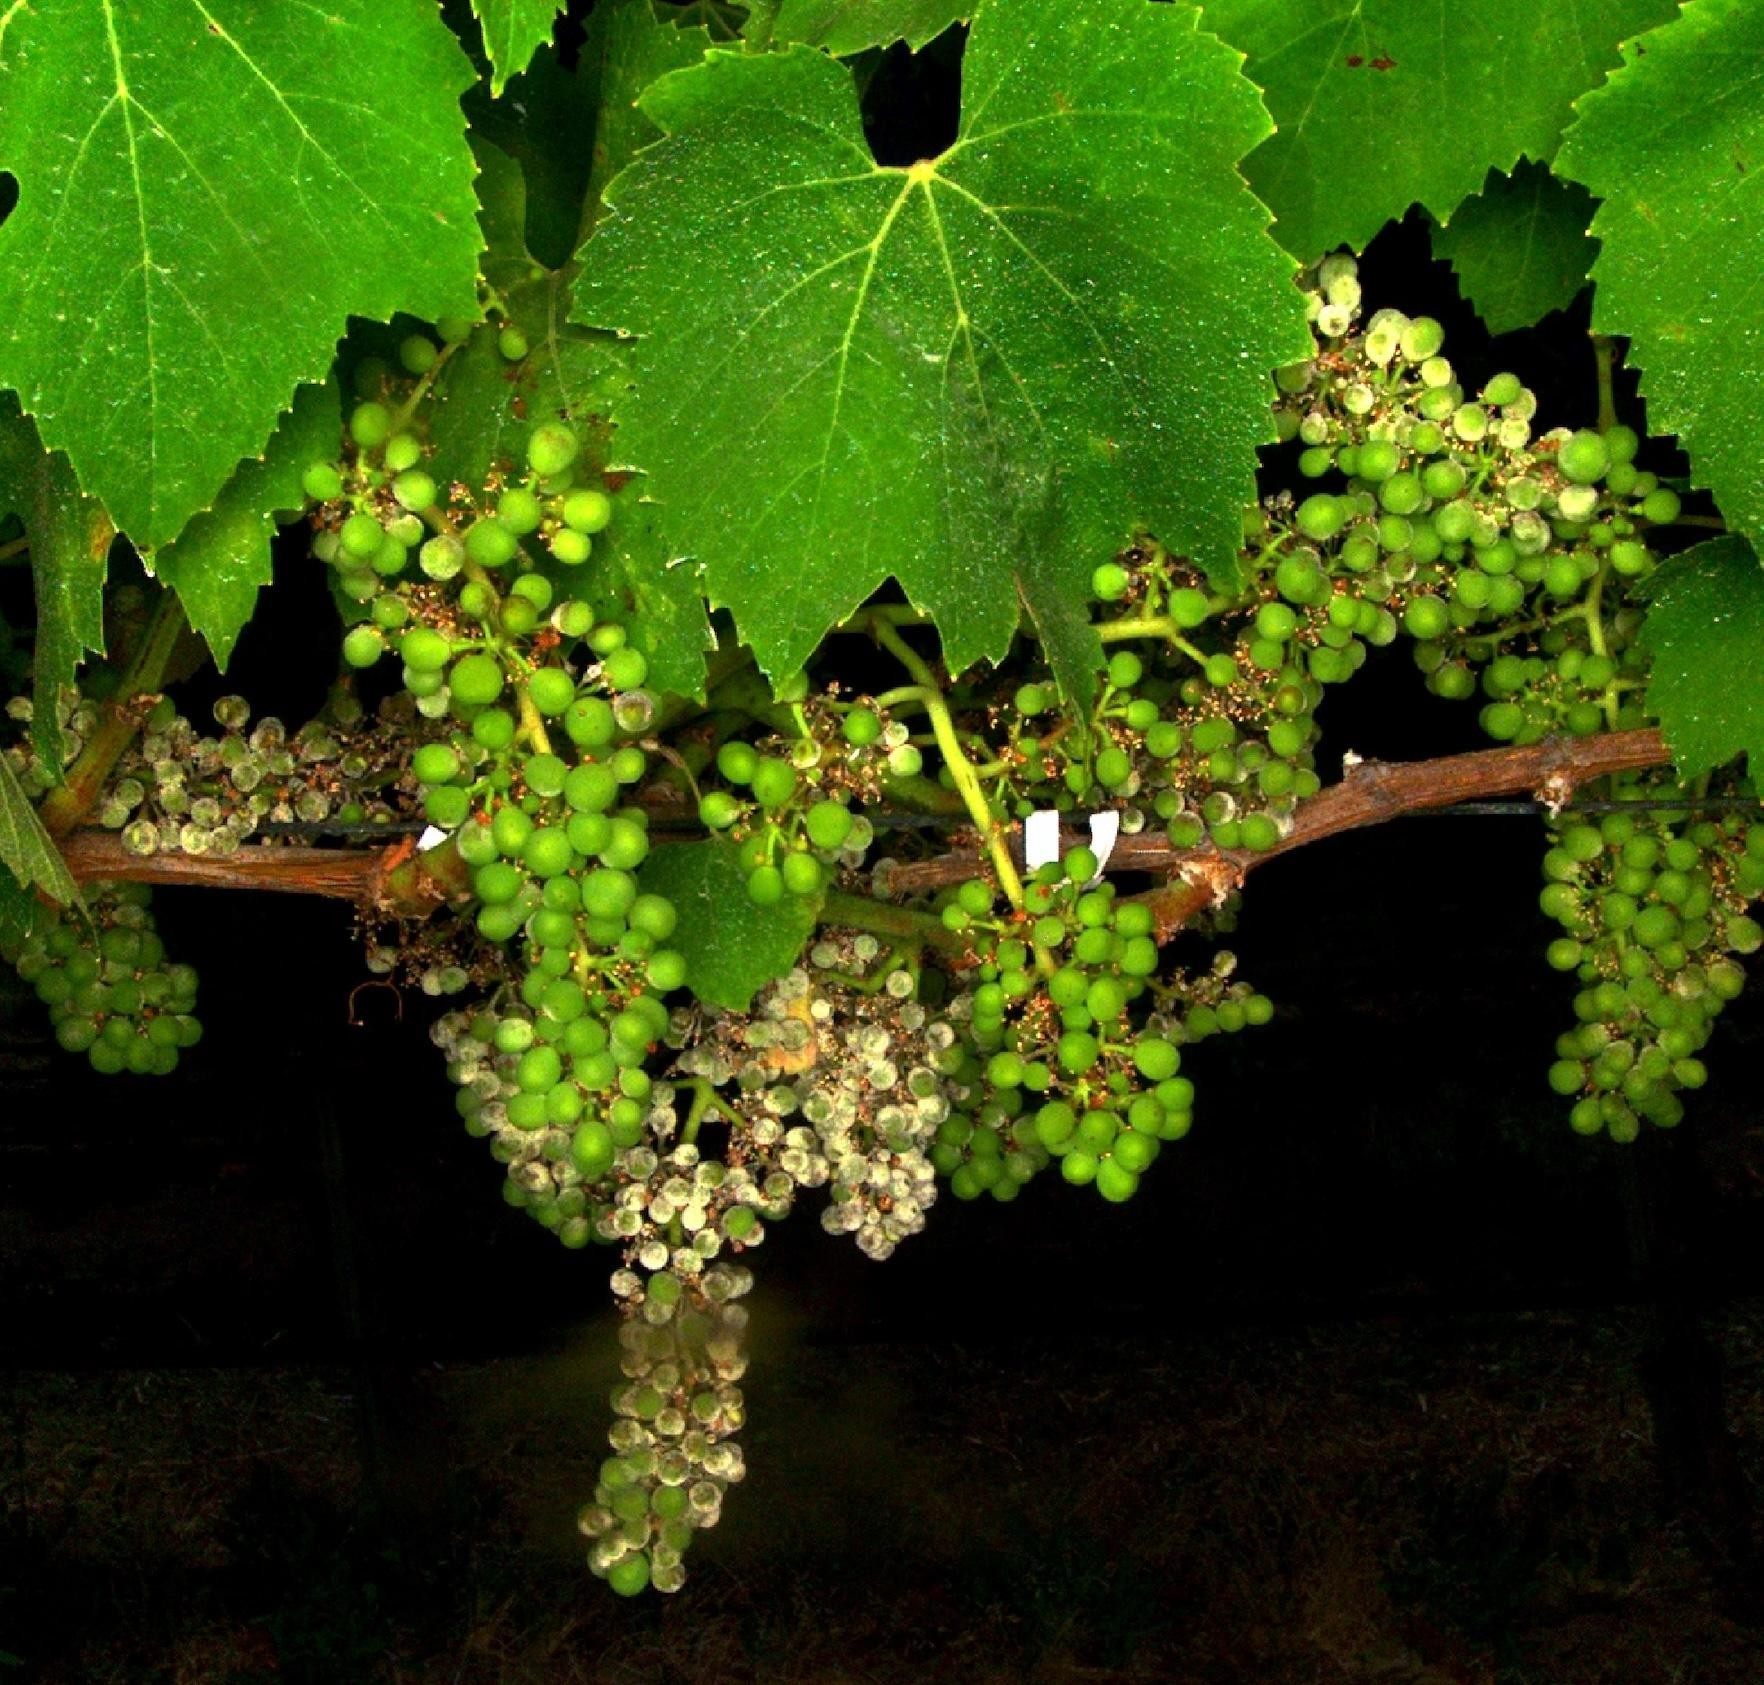
A co-op disease protocol built on data
One quantified disease standard across 85 growers, with an evidence path all the way to fruit rejection.